Algorithms and flowcharts are two different tools used for creating new programs, especially in computer programming. An algorithm is a step-by-step analysis of the process, while a flowchart explains the steps of a program in a graphical way.
Definition of Algorithm
To write a logical step-by-step method to solve the problem is called the algorithm; in other words, an algorithm is a procedure for solving problems. In order to solve a mathematical or computer problem, this is the first step in the process. An algorithm includes calculations, reasoning, and data processing. Algorithms can be presented by natural languages, pseudocode, and flowcharts, etc.
Definition of Flowchart
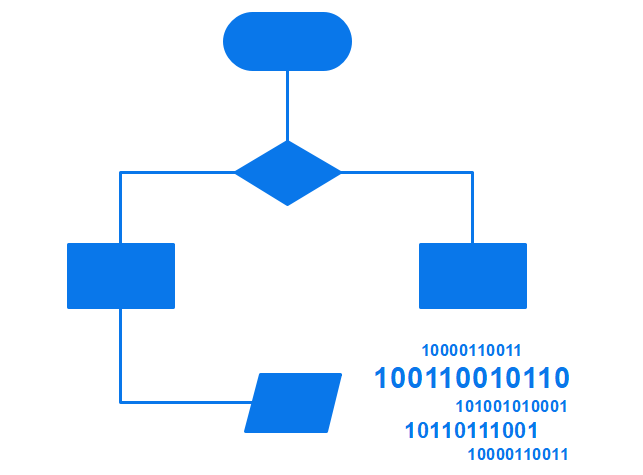
A flowchart is the graphical or pictorial representation of an algorithm with the help of different symbols, shapes, and arrows to demonstrate a process or a program. With algorithms, we can easily understand a program. The main purpose of using a flowchart is to analyze different methods. Several standard symbols are applied in a flowchart:
| Terminal Box - Start / End |  |
| Input / Output |  |
| Process / Instruction |  |
| Decision |  |
| Connector / Arrow |
The symbols above represent different parts of a flowchart. The process in a flowchart can be expressed through boxes and arrows with different sizes and colors. In a flowchart, we can easily highlight certain elements and the relationships between each part.
Difference between Algorithm and Flowchart
If you compare a flowchart to a movie, then an algorithm is the story of that movie. In other words, an algorithm is the core of a flowchart. Actually, in the field of computer programming, there are many differences between algorithm and flowchart regarding various aspects, such as the accuracy, the way they display, and the way people feel about them. Below is a table illustrating the differences between them in detail.
| Algorithm | Flowchart |
|---|---|
| It is a procedure for solving problems. | It is a graphic representation of a process. |
| The process is shown in step-by-step instruction. | The process is shown in block-by-block information diagram. |
| It is complex and difficult to understand. | It is intuitive and easy to understand. |
| It is convenient to debug errors. | It is hard to debug errors. |
| The solution is showcased in natural language. | The solution is showcased in pictorial format. |
| It is somewhat easier to solve complex problem. | It is hard to solve complex problem. |
| It costs more time to create an algorithm. | It costs less time to create a flowchart. |
Carry on baba ji
ReplyDelete